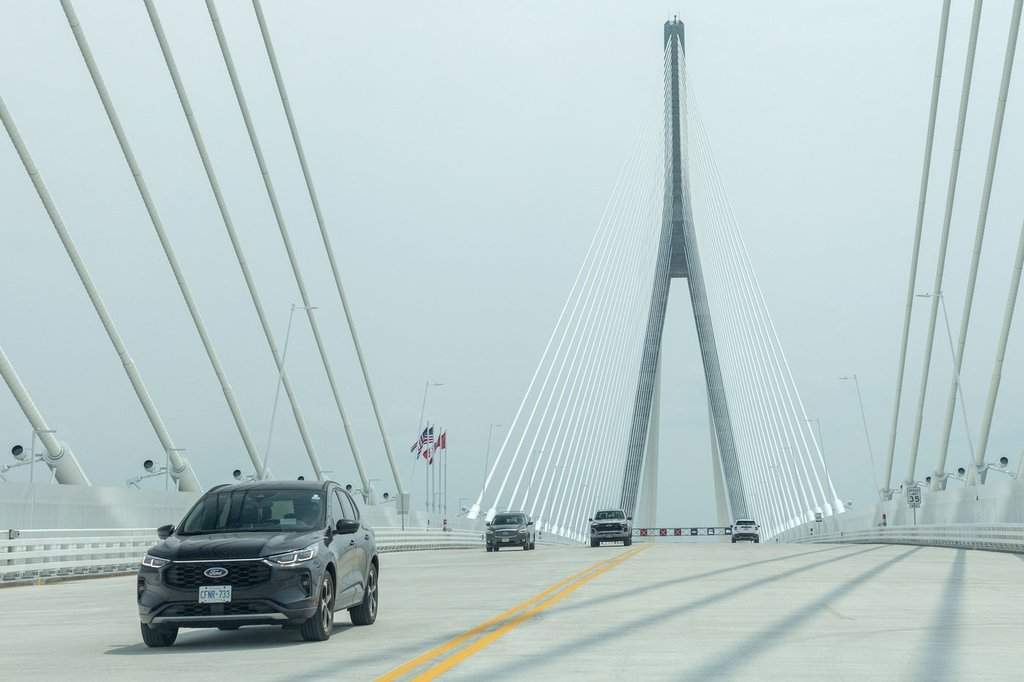
The Infrastructure Throughput Baseline
The opening of a major international trade corridor creates an immediate shock to regional mobility networks. When Statistics Canada recorded more than 41,000 crossings during the first five days of the Gordie Howe International Bridge operation, the metric served as a raw indicator of baseline demand rather than a settled equilibrium. Infrastructure performance cannot be evaluated on raw volume alone; throughput must be analyzed through the lens of capacity utilization, network redistribution, and friction reduction.
[Raw Demand Shock]
       │
       ▼
[Capacity Utilization] ──► [Friction Reduction at Border Nodes]
       │
       ▼
[Supply Chain Realignment]
To understand the operational significance of this initial traffic surge, the system must be deconstructed into three core structural components: You might also find this connected article interesting: The Weight of Silence Across the Border.
- Node Efficiency: The processing speed at customs plazas on both the Michigan and Ontario sides.
- Corridor Redundancy: The degree to which freight operators shift away from legacy bottlenecks like the Ambassador Bridge or the Detroit-Windsor Tunnel.
- Temporal Distribution: The smoothing of peak-hour congestion through pricing mechanisms or schedule adjustments by commercial carriers.
The initial five-day count demonstrates high latent demand. Commercial logistics networks and passenger vehicles immediately tested the new infrastructure, verifying that the physical asset could absorb heavy multi-axle freight alongside commuter traffic without immediate structural queuing failures.
The Economic Mechanics of Border Friction
Border crossings function as economic tollbooths that impose a tax on velocity. Every minute a commercial vehicle spends idling at an international port of entry translates directly into lost inventory turnover and increased fuel expenditure. The Gordie Howe Bridge alters the regional cost function by expanding physical lane capacity and implementing modern electronic tolling and inspection architecture. As extensively documented in recent coverage by NBC News, the effects are significant.
Traditional crossings suffer from geometric constraints. Legacy bridges built in the early-to-mid twentieth century feature narrow lane widths, restricted turning radii for modern 53-foot semi-trailers, and constrained plaza footprints that prevent scale economies in customs inspection. By contrast, a modern infrastructure asset alters these variables by redesigning the approach geometry.
The primary variables governing border transit efficiency can be expressed through operational mechanics:
- Processing Latency ($L$): The total duration from port entry to customs clearance release.
- Queue Length ($Q$): The spatial footprint of waiting vehicles, which directly impacts municipal arterial traffic.
- Throughput Velocity ($V$): The average speed at which commercial goods traverse the international boundary zone.
When $L$ decreases, $Q$ collapses, allowing $V$ to approach the design speed of the highway network. The 41,000-plus crossings recorded in the initial window indicate that the system's baseline $V$ remained high despite the novelty of the route, suggesting that driver familiarity and automated toll systems functioned without catastrophic software or physical bottlenecks.
Network Redistribution and the Detroit-Windsor Corridor
The introduction of a competing international crossing fundamentally alters the game theory of cross-border logistics. Previously, the Detroit-Windsor transit corridor operated under a localized oligopoly dominated by the Ambassador Bridge and the Detroit-Windsor Tunnel. This lack of structural redundancy exposed supply chains to single-point-of-failure risks, including labor disputes, maintenance shutdowns, and security alerts.
Legacy Duopoly:
[Ambassador Bridge] ◄──► [Detroit-Windsor Tunnel]

Tri-Asset Network:
[Ambassador Bridge] ◄──► [Gordie Howe Bridge] ◄──► [Detroit-Windsor Tunnel]
With the Gordie Howe Bridge fully integrated into the regional transportation grid, the corridor shifts to a tri-asset network. Shippers gain route optionality, forcing legacy operators to compete on service quality, clearance times, and potentially toll structures.
The redistribution of traffic follows a gravitational model of trade. Commercial fleets based in the American Midwest—particularly those moving automotive components, agricultural goods, and manufactured products destined for Ontario assembly plants or eastern Canadian distribution hubs—calculate route selection based on total generalized cost:
$$\text{Cost} = \text{Toll Price} + (\text{Transit Time} \times \text{Value of Time}) + \text{Fuel Burn}$$
Because the new bridge connects directly to the Ontario Highway 401 corridor via dedicated access ramps, it eliminates the surface street navigation required when exiting older downtown-adjacent crossings. This structural alignment removes stop-and-go urban friction from the heavy freight equation, lowering the second and third variables in the generalized cost equation.
Supply Chain Integration and Just-In-Time Vulnerabilities
Automotive supply chains operate on strict temporal tolerances. Just-in-time manufacturing models leave zero margin for unpredicted border delays; a delayed transmission or wiring harness can shut down an entire final assembly line hundreds of miles away.
The initial volume surge captured by Statistics Canada reflects pent-up demand from enterprise logisticians eager to stress-test the new corridor for their JIT schedules. Rather than treating the 41,000 crossings as a static milestone, supply chain engineers view it as a stress test of the customs brokerage ecosystem.
- Primary Risk Factor: Customs software integration between the Canada Border Services Agency (CBSA) and U.S. Customs and Border Protection (CBP).
- Secondary Risk Factor: Drayage driver availability and local interchange yard capacity.
- Tertiary Risk Factor: Weather vulnerability on high-span cable-stayed structures during severe winter storm events.
During the opening window, these variables remained favorable. However, true systemic resilience is only proven when the infrastructure encounters peak seasonal volume spikes, severe weather events, or cross-border regulatory shifts. The absence of major queuing incidents during the initial five-day adoption phase validates the engineering assumptions underpinning the port of entry plaza designs.
Regional Real Estate and Logistics Hub Valuation
Infrastructure investments of this magnitude generate second-order effects across commercial real estate markets in Essex County and Wayne County. Industrial land valuation models within a twenty-mile radius of the new bridge terminals must be recalibrated to account for the reduction in drayage friction.
Logistics facilities derive value from their proximity to high-velocity transportation nodes. When transit time to the international border drops, the effective radius of viable warehouse locations expands. Developers who anticipated this shift capitalized on industrial land parcels along the Rt. 401 corridor years prior to ribbon-cutting.
[Reduced Border Friction]
          │
          ▼
[Expanded Warehouse Catchment Area]
          │
          ▼
[Industrial Land Value Realignment (Essex/Wayne Counties)]
The economic capture of these infrastructure changes follows a predictable trajectory:
- Phase One involves immediate transport cost savings for existing fleet operators.
- Phase Two triggers spatial reorganization, where distribution centers relocate to optimize inbound and outbound drayage routes.
- Phase Three results in structural wage and employment adjustments within the regional warehousing and logistics labor pools.
Municipal planners must manage the municipal infrastructure load accompanying this industrial realignment. Arterial roads connecting local distribution parks to the bridge access points face heavier axle loads, requiring sustained capital expenditure on pavement management systems.
Long-Term Capital Allocation and Corridor Optimization
Optimizing the Detroit-Windsor trade corridor requires continuous measurement against key performance indicators that extend far beyond initial vehicle counts. While 41,000 crossings in five days provides a strong directional signal of public and commercial adoption, the metric must transition from a headline figure to an operational baseline.
Future performance evaluations should focus on variance in clearance times rather than absolute volume. A high-performing border crossing minimizes the standard deviation of processing time, allowing fleet managers to build tighter, more reliable delivery schedules.
Institutional stakeholders—including state and provincial departments of transportation, federal customs agencies, and private concessionaires—must now direct capital toward predictive analytics platforms that dynamically manage toll pricing and lane allocation based on real-time trade density and weather forecasting. The competitive dynamics established by the new bridge ensure that regional supply chain velocity will remain a key differentiator for North American manufacturing competitiveness.


